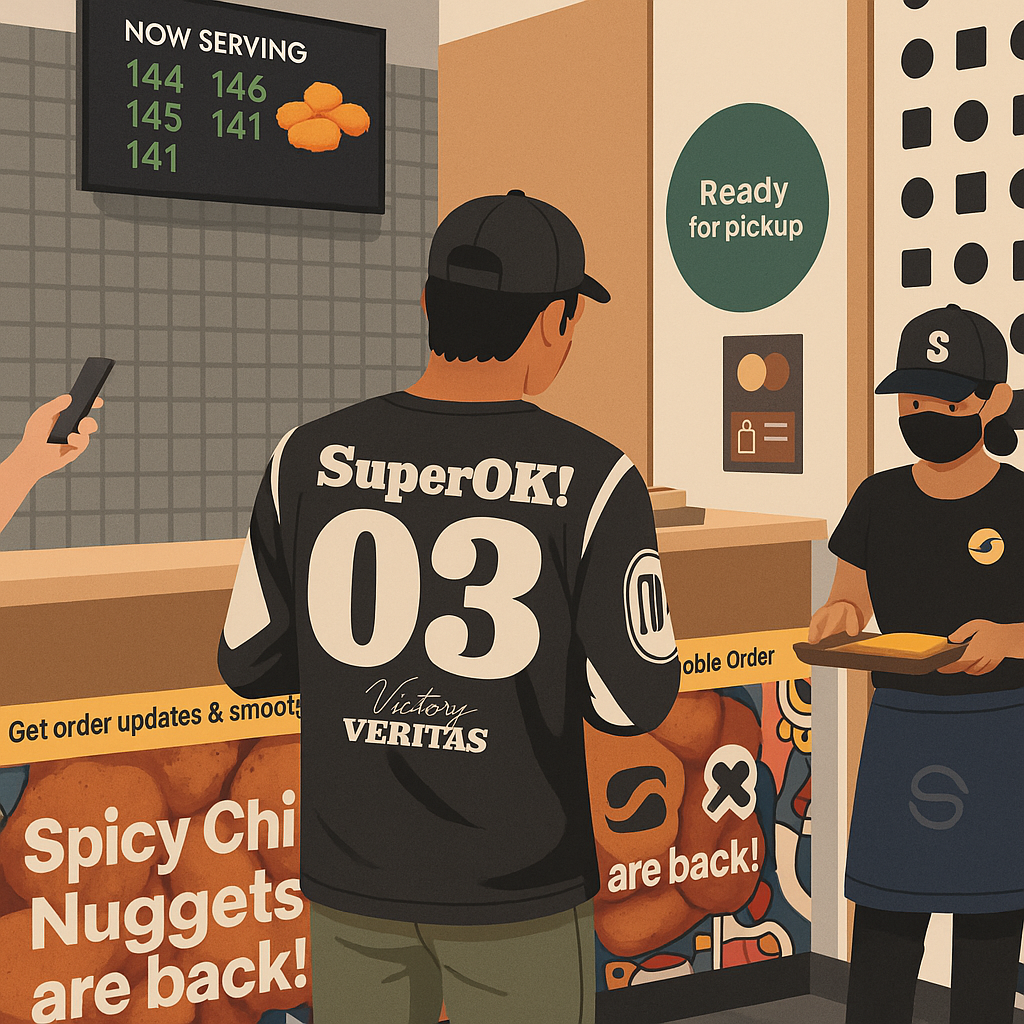
Ever stood at the most popular fast-food chain in Singapore (where, in my opinion, this issue feels especially pronounced), staring at the giant digital order screen that supposedly tells you when your food is ready? It looks slick—numbers updating in real time, animations flying—but you’re still standing there five minutes after your number disappeared. Or your food is ready before it even shows up. The system’s working—but no one believes it anymore.
That’s exactly the kind of trap we fall into with observability in engineering teams.
When Observability Exists But Doesn’t Help
We all know when monitoring is missing—that’s obvious. But there’s a sneakier problem: dashboards, alerts, and metrics that exist but don’t actually help anyone.
Here’s the usual setup:
Telemetry Collection & Storage
You’ve got your Prometheus, OTEL, or some vendor agent scraping metrics from apps, infra, and services. Cool. But collecting data doesn’t mean people know what to do with it.Dashboards & Visualization
This is where a lot of us screw up. We throw every chart we can think of into Grafana—CPU, memory, HTTP codes, request rates. Technically correct, but not what folks actually need when things are on fire. What we really care about is stuff like “are users able to log in?” or “are purchases going through?”Alerts & Incident Response
Without context and clear ownership, alerts turn into background noise. Nobody wants to be paged for a spike that recovers in 30 seconds. If the alert doesn’t help fix or prevent something, it’s just noise.
The Fast-Food Display Syndrome
Back to the food court analogy: the screen is up and running, but it doesn’t match reality. The staff are doing their thing, orders are flying, but what’s shown on screen has little to do with what’s actually happening. People start ignoring it.
Same thing happens to your dashboards if they’re disconnected from what your system or users are really doing. Trust dies. And without trust, the whole observability setup is just noise and sunk cost.
- 🛠️ Slow Incident Response: People rely on MS Teams chats and tribal knowledge instead of the data.
- 📦 Guesswork on Scaling: Infra gets over- or under-provisioned because we’re not using real signals.
- 🧪 Performance Slips Under the Radar: Gradual regressions sneak past everyone.
- 📉 Nobody Maintains Dashboards: They rot because nobody’s using them.
How to Build Observability Engineers Actually Use
Let’s get back to basics:
1. Start With What Actually Matters
Think like a user. What’s the failure that makes people angry? Start from there, then trace it to signals your system produces. Track those.
- Instead of counting 500s, measure failed checkouts or dropped login attempts.
- Don’t just chart latency—track whether you’re meeting your SLA per endpoint or function.
2. Cut the Noise
Prometheus can scrape everything, but that doesn’t mean it should. Keep dashboards tight and focused. Each one should have a reason to exist.
- One “main” dashboard per service.
- Keep it clean. Only show what SREs or devs actually look at during incidents.
3. Make Alerts Useful Again
Good alerts are rare. They tell the right team what’s wrong, why it matters, and what to do next. If an alert doesn’t meet that bar, it’s a log line pretending to be useful.
4. Tune Constantly
Check who’s acknowledging alerts. When was the last time a dashboard was opened? If nobody’s using a panel, archive it or fix it.
5. Make Observability Part of the Routine
Don’t wait for a P1 to look at dashboards. Bring them into standups, retro, postmortems. Ask “what would’ve made this easier to catch?”
Final Thought: Are You Building Control Towers or Eye Candy?
Observability should help you run your systems—not just decorate your wiki or status board. If your team doesn’t trust your metrics or ignores your dashboards, that’s not just an ops issue—it’s a broken feedback loop.
Before you add another panel or scrape job, ask:
“Is anyone using the stuff we already have?”
If not, you’re just building another fast-food display—looks cool, tells you nothing.
